It looks like I was not able to make good on my promise to more frequently post content I find interesting, as it has been almost two years since the last post and almost five since any actual content was posted!
However, today I would like to come back and start talking about home automation. In the past four years, I have gotten deeper into home automation, specifically with Home Assistant. I’ll post more later on how I’m now running the Docker container for HA, but today I’d like to talk about one specific use-case I recently solved.
My ISP is Comcast, which unfortunately still believes in data caps – specifically 1.2Tb of usage per month across all of their consumer plans. They provide access to your “usage” via their app or website, but provide no data on how quickly it is being used and the data can be delayed by up to 24 hours. I wanted something better and found a way to vastly improve my tracking in real-time.
Below are three graphs showing hourly, daily, and monthly traffic usage for my home. Note: since I just set this up on April 9, there is limited “daily” and “monthly” data in the graphs.

To accomplish these graphs, I am leveraging SNMP traps on my router which is then being captured by HA and brought into template sensors and utility_meter tracking sensors for time-period accumulation. I am then able to display this data in a variety of ways as well as wrap notification automations around it for alerting if certain thresholds are exceeded.
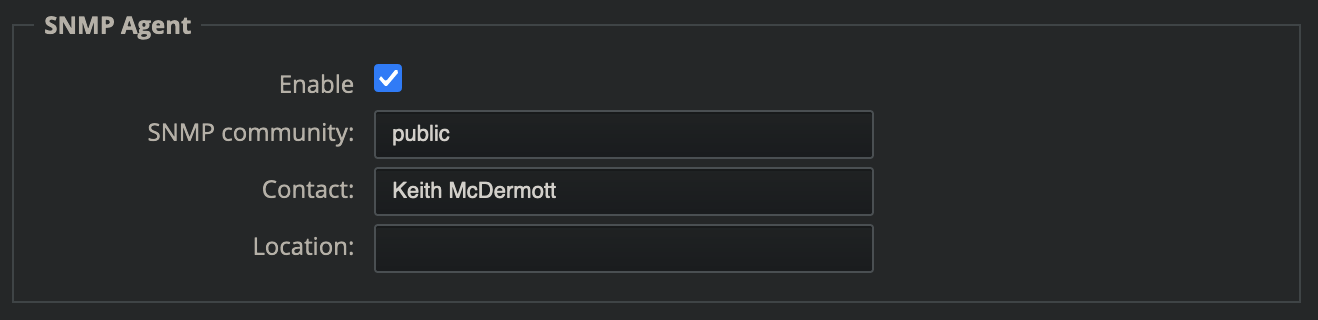
To begin, let’s capture the WAN In/Out data and accumulate it. I use high-quality networking equipment from Ubiquiti – specifically an EdgeRouter Lite 3 (ERL3), several Unifi Access Points, and their controller software to manage the APs. For this write-up, we are only focusing on the ERL3. In the setup section of the ERL3 UI, enable SNMP and configure the Community name and other relevant details.
Next, setup several new sensors in HA. These will need to be manually added in your configuration.yaml and are all defined as below. Remember that if you already have a sensor and utility_meter section, just add the sensors and utility meters and don’t create another new section or your other sensors and utility meters will be ignored by HA.
sensor:
  - platform: snmp
    name: wan_in
    baseoid: 1.3.6.1.2.1.2.2.1.10.2
    host: !secret erl3_hostname
    version: !secret erl3_snmp_version
    community: !secret erl3_community
    accept_errors: true
    scan_interval: 10
  - platform: snmp
    name: wan_out
    baseoid: 1.3.6.1.2.1.2.2.1.16.2
    host: !secret erl3_hostname
    version: !secret erl3_snmp_version
    community: !secret erl3_community
    accept_errors: true
    scan_interval: 10
  - platform: derivative
    name: wan_in_der
    source: sensor.wan_in
    unit_time: s
    unit: B
  - platform: derivative
    name: wan_out_der
    source: sensor.wan_out
    unit_time: s
    unit: B
  - platform: template
    sensors:
      wan_in_mbps:
        value_template: "{{ [((states('sensor.wan_in_der')|float*8)/1000000)|round(2),0]|max }}"
        unit_of_measurement: 'Mbps'
        friendly_name: "WAN In"
      wan_out_mbps:
        value_template: "{{ [((states('sensor.wan_out_der')|float*8)/1000000)|round(2),0]|max }}"
        unit_of_measurement: 'Mbps'
        friendly_name: "WAN Out"
      wan_total_mbps:
        value_template: "{{ states('sensor.wan_in_mbps')|float + states('sensor.wan_out_mbps')|float }}"
        unit_of_measurement: 'Mb'
        friendly_name: "WAN Total"

utility_meter:
  internet_usage_in:
    source: sensor.wan_in
    name: 'WAN IN Usage'
  internet_usage_monthly:
    source: sensor.wan_total_mbps
    name: Monthly WAN Usage
    cycle: monthly
  internet_usage_daily:
    source: sensor.wan_total_mbps
    name: Daily WAN Usage
    cycle: daily
  internet_usage_hourly:
    source: sensor.wan_total_mbps
    name: Hourly WAN Usage
    cycle: hourly
Let’s break these down.
First, we defined SNMP sensors for the WAN In and WAN Out traps from the ERL3. The exact entity IDs you will need to utilize will vary highly. I used a tool on the Mac to navigate around the MIB for my ERL3, but it was really trial and error for me. I’m not an expert in how SNMP works and this is my first introduction into that world.
Next, we need to do some math on the values coming in. I leveraged examples from this page and modified them to match my setup. This ensures that the data we use are cleaned up.
Finally, we need utility_meter sensors to accumulate the data. I have setup several including three with cycles on them so that the data will reset each hour/day/month. Without a cycle setting, there’s no way to accumulate data into discrete time periods and you’re only seeing real-time data that will build up over time and never reset. This is fine if you want to use a history card, but not very useful for more robust analytics and automations. Restart HA and your new config changes will be picked up and data will start to accumulate.
Now that we have the data, let’s circle back to our graphs. I am utilizing the mini-graph-card installed through HACS. This guide will not go into how to install that, but you can find it on the HACS store. Be sure to restart HA after the install.
Below is the YAML I am using for the cards displayed above.
type: vertical-stack
cards:
  - type: custom:mini-graph-card
    entities:
      - entity: sensor.hourly_wan_usage
        name: Hourly WAN
    hour24: true
    hours_to_show: 24
    name: Hourly WAN Usage
    points_per_hour: 1
    show:
      extrema: true
  - type: custom:mini-graph-card
    entities:
      - sensor.daily_wan_usage
    name: Daily WAN Usage
    hours_to_show: 744
    aggregate_func: max
    group_by: date
    show:
      extrema: true
  - type: custom:mini-graph-card
    entities:
      - sensor.monthly_wan_usage
    name: Monthly WAN Usage
    hours_to_show: 8760
    aggregate_func: max
    group_by: date
    show:
      extrema: true
Next, let’s create some automations! I wanted to be notified if my daily usage is above 20 GB and if my monthly usage exceeds 600GB and 900GB thresholds. This would be sufficient to alert me to high daily usage as well as high monthly usage both before Comcast would notify me and also as I am nearing my cap for the month. Here’s an example of an automation which alerts me to high daily usage.
alias: Internet usage - high daily
description: ''
trigger:
  - platform: numeric_state
    entity_id: sensor.daily_wan_usage
    above: '20000'
condition: []
action:
  - service: notify.notify
    data:
      message: Internet usage for the day has exceeded 20GB!
      title: Home Assistant
mode: single
Finally, let’s kick things up a bit more. How about we add in an Apple Watch complication and a custom push notification?!
I have an Apple Watch Series 7 and wanted to tightly integrate it into my Home Assistant setup in a useful-yet-geeky way. To do so, I created a custom Complication as shown below.
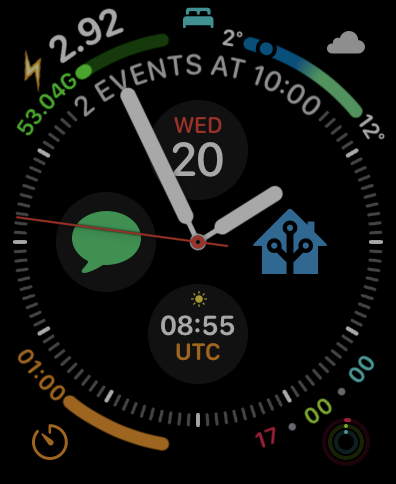
The top left corner is setup to show me my electric usage for the day along with my monthly Internet usage at home along with a guage that will fill as I get closer to my monthly Internet cap. In order to create the displayed Complication, add a Graphic Corner complication with a Template of Gauge Text. The code to display all of this data is as follows.
#Leading section:
{% if states('sensor.monthly_wan_usage')|int < 1000 %} {{ states('sensor.monthly_wan_usage')|int }}M{% elif states('sensor.monthly_wan_usage')|int < 1000000 %}{{ "%.2f"|format(states('sensor.monthly_wan_usage')|float / 1000) }}G{% else %}{{ "%.3f"|format(states('sensor.monthly_wan_usage')|float / 1000000)}}T{% endif %}

#Outer section:
⚡️{{ "%.2f"|format(states('sensor.grid_energy_consumed_daily')|float)}}

#Trailing section: (blank)

#Gauge section:
{{ states('sensor.monthly_wan_usage')|float / 1200000}}
For the final component, I have custom actions setup in my Home Assistant Companion app which display on the Watch. I have one specifically that will send me a push notification “report” on the status of my home, but only if it’s triggered from my Watch. It shows door sensors, motion sensors, electric/internet usage, as well as locations of me and my husband. Below are screenshots of that along with code for the “report”.


alias: Action - Send Keith a status report
description: Send Keith a status report via push notification
trigger:
- platform: event
event_type: ios.action_fired
event_data:
actionName: Send Keith Status Report
condition: []
action:
- service: notify.mobile_app_keith_iphone
data:
title: Home Assistant
message: >
🚪 F:{% if is_state('binary_sensor.front_door_2','on') %}🙋{% endif %}{%
if is_state('binary_sensor.front_door_3', 'off') %}✔️{% else %}❗{% endif
%} P:{% if is_state('binary_sensor.patio_door_2','on') %}🙋{% endif %}{%
if is_state('binary_sensor.patio_door_3','off') %}✔️{% else %}❗{% endif
%} O:{% if is_state('binary_sensor.office_door_2','on') %}🙋{% endif
%}{% if is_state('binary_sensor.office_door_3','off') %}✔️{% else %}❗{%
endif %} B:{% if is_state('binary_sensor.master_bedroom_door_2','on')
%}🙋{% endif%}{% if
is_state('binary_sensor.master_bedroom_door_3','off') %}✔️{% else %}❗{%
endif %}
⚡️ {{ states('sensor.emu2') }}kWh / {{ state_attr('sensor.emu2',
'Delivered kWh') }}
👨🏼💻 {% if states('sensor.monthly_wan_usage')|int < 1024 %} {{
states('sensor.monthly_wan_usage')|int }}Mb{% else %}{{
"%.2f"|format(states('sensor.monthly_wan_usage')|float / 1024) }}Gb{%
endif %}
Keith: {{ states('sensor.keith_iphone_geocode') }}
Zhengbin: {{ states('sensor.zhengbin_iphone_geocode') }}
mode: singleIn conclusion, I am still finding more ways I can extend the configuration created above, but it’s already been very powerful to gain new insights into our Internet usage. I look forward to finding new items I can integrate in similar ways!